


By Clint Sanchez
Small business owners hear a lot of advice about which social platform matters this year. The most useful starting point is plainer than most of that advice: how many people actually use each one.
A new Pew Research Center survey answers that for U.S. adults in 2026. The figures show two platforms with majority reach, several with narrower audiences, and wide gaps by age and by where people live.
What the Survey Measured
Pew’s fact sheet, Americans’ Use of Social Media in 2026, was published on October 19, 2026. It draws on a survey of 5,511 U.S. adults conducted from January 30 to June 18, 2026.
People could answer online, by mail or by phone, and the results are weighted to represent all U.S. adults. The overall margin of error is plus or minus 1.8 percentage points.
One limit matters for reading the numbers. The survey asks if people ever use each platform. It does not measure how often they use it, or if they follow or buy from businesses there.
Two Platforms Reach a Clear Majority
YouTube leads at 84% of U.S. adults. Facebook follows at 70%, or seven in 10. Instagram sits at 51%, about half.
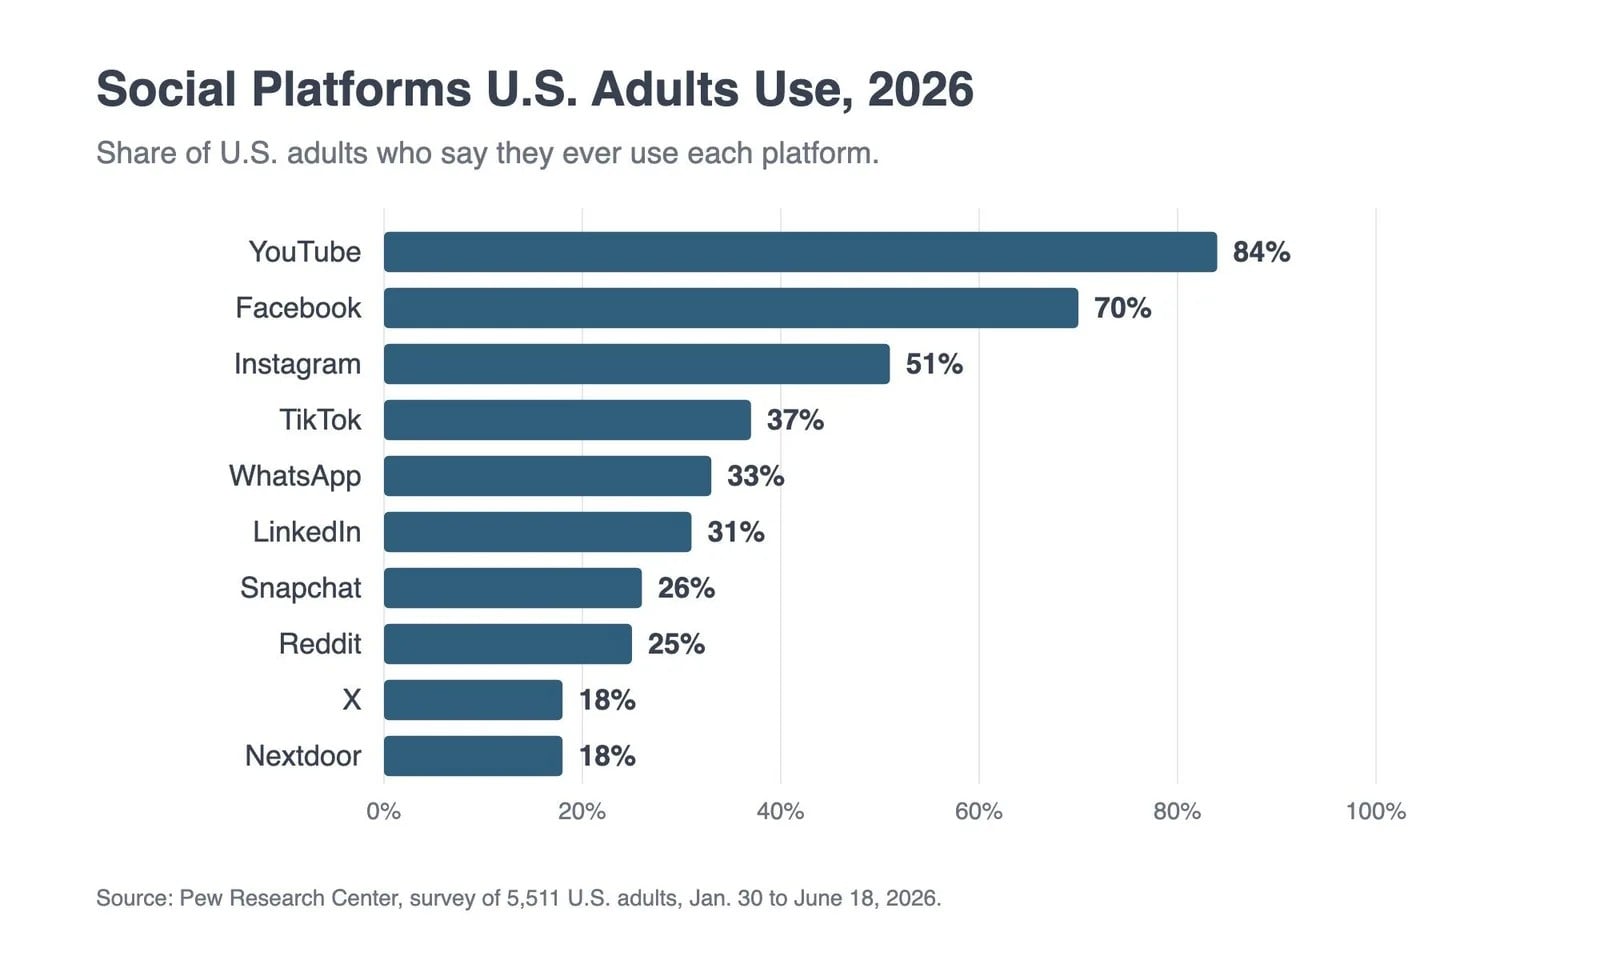
Share of U.S. adults who ever use each platform, 2026.
Below that, the shares drop off. TikTok reaches 37%, WhatsApp 33% and LinkedIn 31%. Snapchat and Reddit are each near one in four, and X and Nextdoor are each at 18%.
Usage Has Held Steady Since 2024
The platform mix has barely moved in three years. Pew’s 2024, 2025 and 2026 surveys were each conducted by web, mail and phone, so they compare directly.
Facebook was at 70% in 2024, 71% in 2025 and 70% in 2026. Instagram went from 50% to 50% to 51%. YouTube moved between 84% and 85%.
TikTok rose from 33% in 2024 to 37% in 2025 and held there. X slipped from 21% in 2024 and 2025 to 18% in 2026. Facebook stood at 54% in Pew’s 2012 survey, though Pew notes that its methods changed over that span.
For an owner, that stability is useful. The platforms that reached customers in 2024 still reach about the same share of them now.
It also cuts against the idea that a business has to chase each new app. Threads and Bluesky, which Pew measured in 2025, reached 8% and 4% of adults that year.
Age Splits the Platforms Apart
The national averages hide large differences by age. Pew reports results for four groups: 18 to 29, 30 to 49, 50 to 64, and 65 and older.
Facebook varies far less by age than YouTube or Instagram. Its use ranges from 59% of adults 65 and older to 78% of adults 30 to 49, a gap of 19 points by our arithmetic. Adults under 30 sit at 69%.
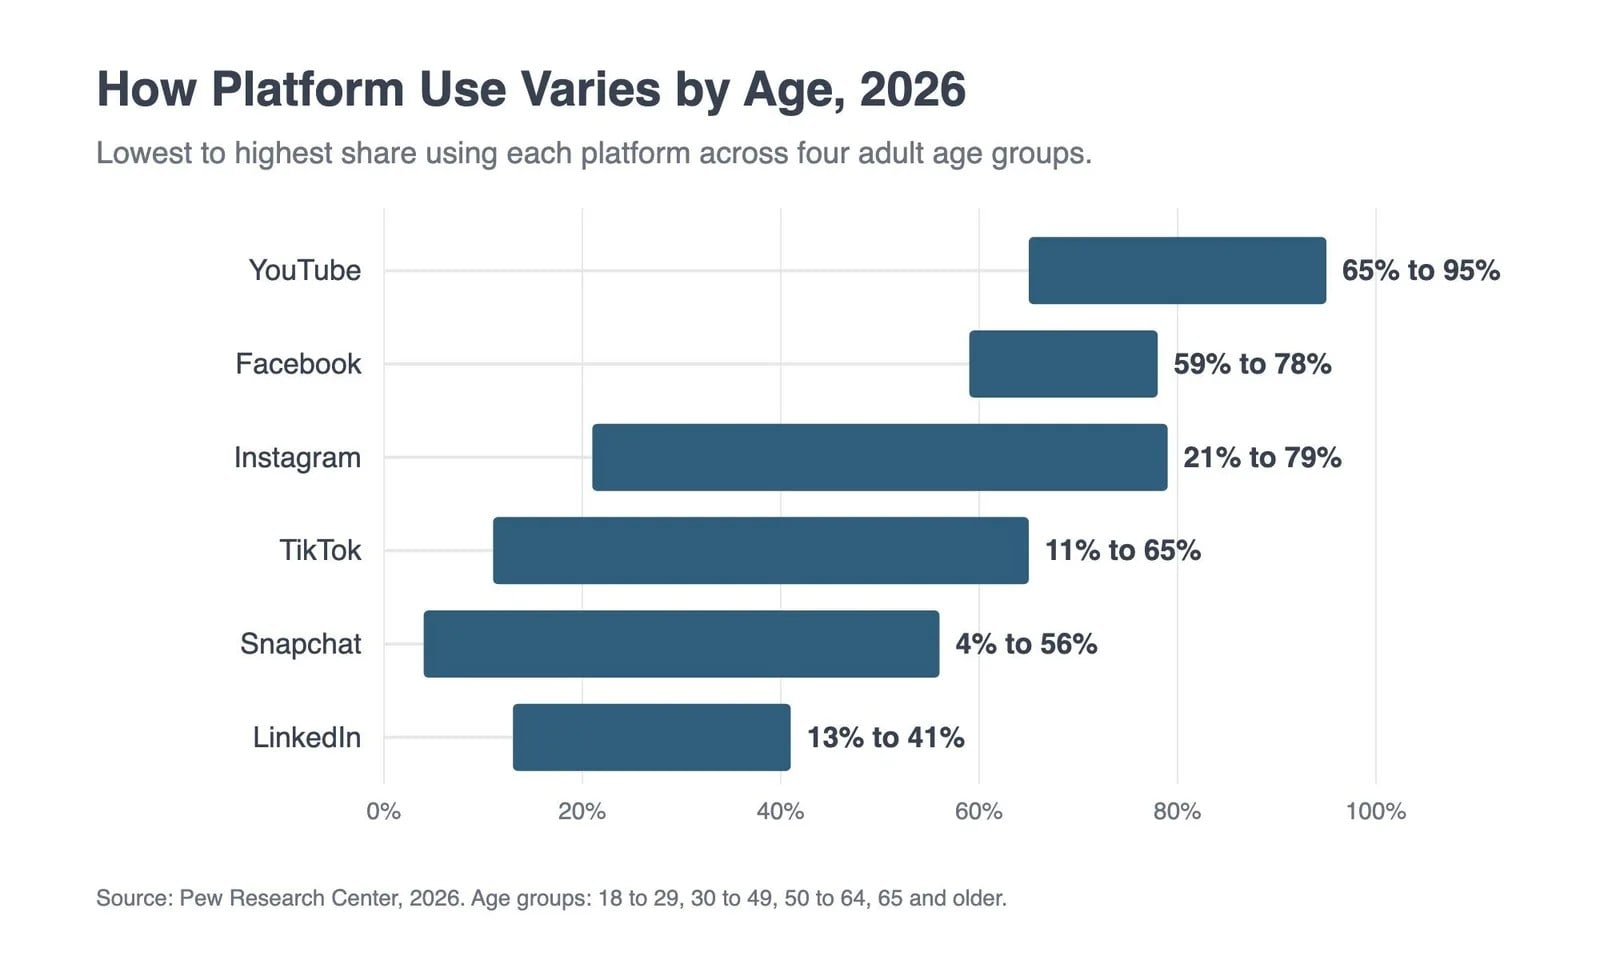
Lowest to highest use across adult age groups, 2026.
Instagram is a different story. It reaches 79% of adults under 30 but only 21% of those 65 and older, a 58-point spread. TikTok runs from 65% of the youngest group to 11% of the oldest.
YouTube reaches 95% of adults under 30 and still 65% of those 65 and older. Snapchat drops from 56% to 4%.
A business whose customers are mostly over 65 reaches a very different share of them on Instagram than a business selling to adults in their 20s does.
Place and Education Matter Too
Where people live shifts the picture. Facebook use is higher in rural areas, at 76%, than in urban areas, at 67%. Instagram runs the other way, at 58% of urban adults and 40% of rural adults.

Nextdoor, built around neighborhoods, reaches 23% of suburban adults. That compares with 15% of urban adults and 11% of rural adults.
LinkedIn follows education and income. It reaches 51% of college graduates and 13% of adults with a high school diploma or less, nearly four times as many. Among adults with household incomes of $100,000 or more, 45% use it, compared with 18% of those earning under $30,000.
Follower Counts Carry Legal Limits
Reach figures invite a shortcut: buying followers or likes to look bigger. Federal rules now address that directly.
The Federal Trade Commission’s Rule on the Use of Consumer Reviews and Testimonials, published in August 2024, makes it a violation to buy or sell fake indicators of social media influence for a commercial purpose. The rule applies when the buyer knew or should have known they were fake.
Most of the rule deals with fake reviews and testimonials. The social media section sits alongside those provisions and defines its terms broadly. Followers, friends, subscribers, views, likes, shares, reposts and comments all count. Fake ones include activity generated by bots, accounts not tied to a real person, and hijacked accounts.
The same rule sets a standard for required disclosures on social media. A disclosure must be unavoidable, so one that a reader has to click a link or hover over an icon to see does not meet it.
What the Numbers Suggest for a Small Business
Taken together, the data points to a simple filter. Start with where the customers are, by age and by place, and not with whichever platform is getting attention this month.
For many local firms, that means Facebook and YouTube reach the widest adult audience, with Instagram strong among younger and urban customers. Narrower platforms such as LinkedIn and Nextdoor can still fit a business whose buyers match their audience.
A practical test is to list the business’s best customers from the past year and ask which of these groups they fall into. The answer can narrow the field to a few platforms.
The survey cannot say which posts bring in customers. It does show where adults spend time, and that the mix has held steady. Owners comparing platforms can set these figures next to a guide to social media marketing for local businesses that covers how to choose among them.
A smaller set of platforms, used consistently and with real followers, fits both the data and the federal rules.